
Investment Solutions
Frontier Financial’s main investment solution consists of its four primary model portfolios. Across the four portfolios the stock (equity) weight increases in 25% increments, moving from the conservative asset mix that contains only 25% stocks, up to the very aggressive asset mix which contains 100% stocks. A separate Frontier Financial proprietary account is used to track each model’s live performance from the end of 2021.
Frontier also uses three secondary model portfolios whose stock weights lie right between those of the four primary models, thus stock weights of about 32.5%, 62.5% and 87.5%. The primary and secondary models’ stock weights may change with financial market conditions, but their wide range allows us to accommodate nearly all levels of client risk tolerance.
The holdings and weights in the stock and bond portions are proportionately the same across the different model portfolios: we just “dial up” the stock exposure and reduce the bond exposure commensurately as the models move up the risk spectrum. For example, if our model calls for 30% Canadian stocks in the stock component, then the conservative model with 25% overall stock exposure will contain 30% x 25% = 7.5% Canadian stocks. Similarly, a more aggressive model with 75% overall stock exposure will have 30% x 75% = 22.5% Canadian stocks.
Why One Set of Model Portfolios?
Unlike many of its competitors, Frontier offers only one set of model portfolios. There are two main reasons for this.
First, one set of model portfolios with the same components in each allows operational efficiency, and also creates consistent performance across different clients and different portfolios.
Second, by offering only one set of model portfolios, Frontier puts its best ideas into just that one set of portfolios, and then lives by its results. Doing so doesn’t guarantee the portfolios’ performance, but it does guarantee that our efforts are focused on those portfolios only. Clients pay us for our expertise, and expertise is what we deliver, not a multitude of choices that forces all the investment decisions back onto the client.
Inside the Portfolios: Types of Holdings
Frontier’s portfolios use investment vehicles such as mutual funds, exchange-traded funds (“ETFs”) and institutional pooled funds instead of individual stocks and bonds. Frontier makes extensive use of passively-managed (“indexed”) vehicles, a very low-cost method to obtain financial market exposure. Passively-managed vehicles almost exactly mimic their underlying benchmark index’s holdings and performance (less the vehicles’ fees). In contrast, the manager of an actively-managed vehicle attempts to outperform the underlying benchmark index by holding only some index constituents, and in different proportions than their index weights. The Topics library's Active Management section compares active management to passive management.
Frontier is not doctrinaire regarding active management. Our default is to employ passive vehicles, but we use an actively-managed vehicle when we think its additional investment return or other benefits will likely outweigh its additional cost. For example, Frontier currently uses an actively-managed vehicle for a sizeable portion of the models’ bond component.
Frontier is not doctrinaire regarding active management. Our default is to employ passive vehicles, but we use an actively-managed vehicle when we think its additional investment return or other benefits will likely outweigh its additional cost. For example, Frontier currently uses an actively-managed vehicle for a sizeable portion of the models’ bond component.
Broad Asset Mix and Diversification
Frontier’s investment portfolios are very broadly diversified. For example, on a look-through basis its bond component owns the debt of more than 200 different issuers. Its stock component similarly owns shares in more than 1500 companies located in Canada and across the world, in all industries.
The models’ geographic stock exposure is allocated approximately evenly between Canadian, US and international stocks, albeit with significant leeway. The portfolios are neither Canada-focused nor Canada-avoiding. This provides significant protection against an unforeseen problem in any one region, such as US stocks’ “lost decade” from 2000-2009, and also allows comparability with many mutual fund portfolio programs offered throughout Canada.
The models’ geographic stock exposure is allocated approximately evenly between Canadian, US and international stocks, albeit with significant leeway. The portfolios are neither Canada-focused nor Canada-avoiding. This provides significant protection against an unforeseen problem in any one region, such as US stocks’ “lost decade” from 2000-2009, and also allows comparability with many mutual fund portfolio programs offered throughout Canada.
Simple doesn't mean Simplistic
The Frontier portfolios’ asset mixes make them broadly comparable to mutual fund portfolio programs, but that doesn’t mean we mimic those programs and rely only on our lower fees to “deliver the goods.”
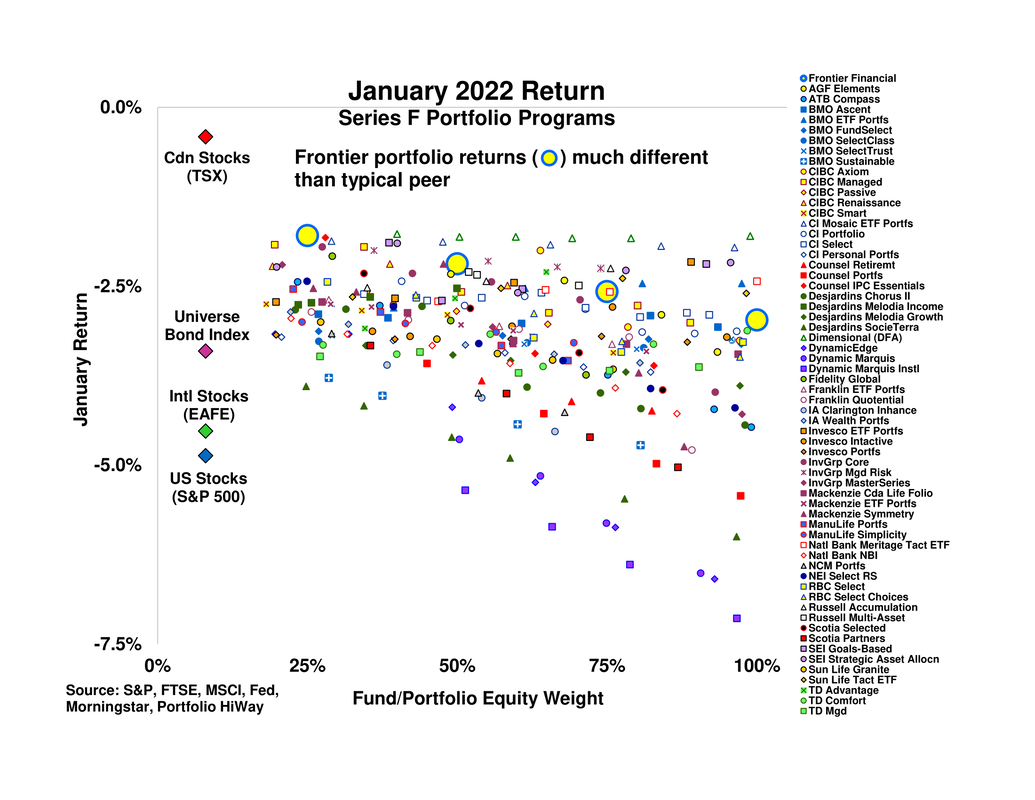
Rather, Frontier’s portfolios differ significantly from its competitors' in several respects. For example, the chart below compares the Frontier portfolios’ January 2022 returns to those of sixty-one portfolio programs available in Canada. Returns on the vertical axis are shown net of all expenses for Series F or equivalent funds (i.e. those used in fee-based accounts), and each fund’s stock weight is shown on the horizontal axis. The Frontier portfolio returns and stock weights are shown by the large blue and yellow circles. The January results of four main asset class benchmarks are shown as diamonds on the chart’s left side.
Rather, Frontier’s portfolios differ significantly from its competitors' in several respects. For example, the chart below compares the Frontier portfolios’ January 2022 returns to those of sixty-one portfolio programs available in Canada. Returns on the vertical axis are shown net of all expenses for Series F or equivalent funds (i.e. those used in fee-based accounts), and each fund’s stock weight is shown on the horizontal axis. The Frontier portfolio returns and stock weights are shown by the large blue and yellow circles. The January results of four main asset class benchmarks are shown as diamonds on the chart’s left side.
|
During a month in which the Universe Canadian Bond Index return was down -3.4% and international and US stocks were down -4.5% or more, Frontier’s most conservative portfolio (25% stocks; leftmost) was down only -1.7%, better than nearly all funds with similar stock weightings. Frontier’s 100%-stocks portfolio (rightmost) also outperformed most of its peers, though its stock exposure is currently entirely passive and so involves no individual stock-selection in any of its investment vehicles. |
Click to enlarge, click outside image or Esc to return.
|
|
Mutual fund return and asset mix data provided by Morningstar. Frontier portfolio returns calculated from custodial data provided by Portfolio HiWay Inc.
|
This doesn’t mean that such outsized results will continue, and we disavow any such claim. For example, a one-month bond market decline of -3.4% is uncommon. But it does show that Frontier’s portfolios aren’t carbon copies of its competitors': we don’t hesitate to do things differently than "the herd."